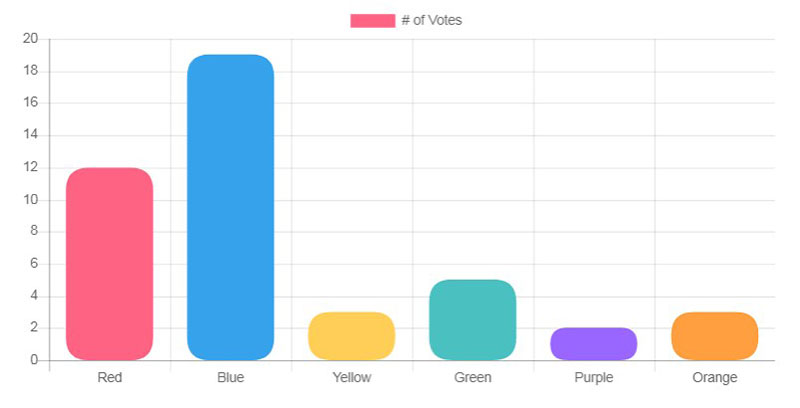
whats the meaning of chart?
- Charts are far better for displaying data visually than tables and have the added benefit that no one is ever going to press-gang them into use as a layout tool. They’re easier to look at and convey data quickly, but they’re not always easy to create.
 ]
]
what is HTML5 Canvas Element ?
The HTML5 element gives an easy and powerful way to draw graphics using JavaScript. It can be used to draw graphs, make photo compositions or do simple (and not so simple) animations.
types of graph?
- ine
- Bar
- Doughnut
- Pie
- Radar
- Polar Area
- Bubble
- Scatter
step to create chart:
- First include the chart.js in the HTML
- Create canvas: To create a chart we need to represent the Chart class. In order to do this, we need to pass jQuery instance or 2d context of the canvas of where we want the place or draw the chart. For example:
<canvas id = ”chart” width=”900” height = “900”> </canvas>
-
Type of Chart and Data: Decide what type of chart is required and prepare the data accordingly. Data requires labels, datasets, data values, backgroundColor,borderColor, borderWidth and various other option
-
Create a graph: After defining what type of graph is to be drawn, pass the data to that graph that we want to visualize.
.png) ]
]
 ]
]